


Simple Definition
The Price-to-Earnings (P/E) ratio is a simple valuation metric that tells you how expensive a company’s stock is relative to its annual earnings. It shows how much investors are willing to pay for each dollar the company makes.
The Big Idea (Using an Analogy)
Imagine you’re buying a small vending machine business. The price you pay for the business is the “P” (Price). The profit the business generates in one year is the “E” (Earnings). If you pay $10,000 for the business and it makes $1,000 in profit per year, its P/E ratio is 10 ($10,000 / $1,000). This means it would take 10 years of current profits to earn back your initial investment. A lower P/E is like getting a better deal on the price of those yearly profits.
How Traders Use It
Investors use the P/E ratio to answer the question: “Is this stock relatively cheap or expensive compared to its competitors or its own history?” It’s a quick way to gauge market expectations. A high P/E might suggest investors expect high future growth, while a low P/E might suggest the stock is undervalued or in a slow-growth industry.
A Simple Example
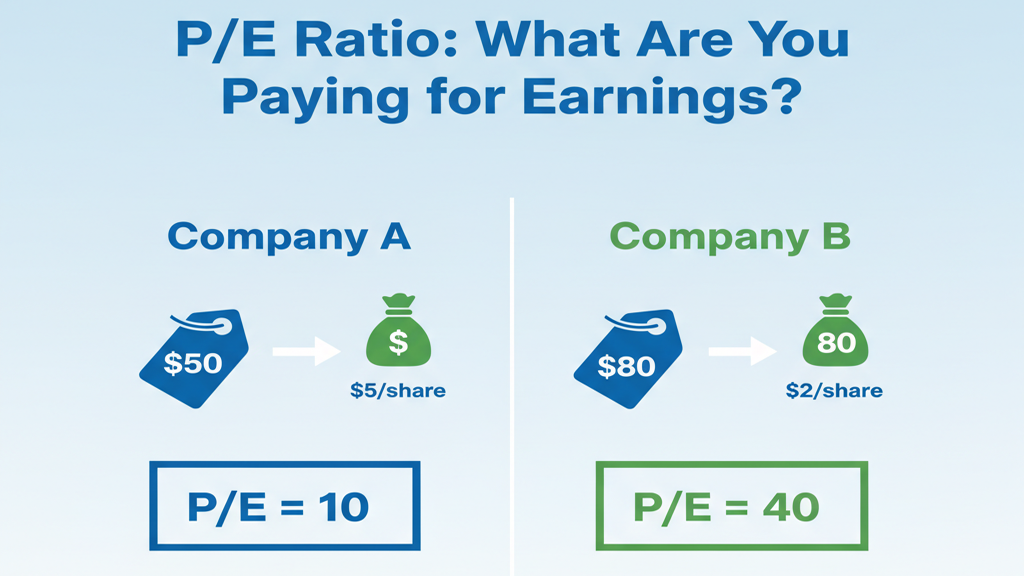
- Company A has a stock price of $50 per share and its Earnings Per Share (EPS) is $5. Its P/E ratio is 50÷5=10.
- Company B, in the same industry, has a stock price of $80 per share and its EPS is $2. Its P/E ratio is 80÷2=40.Based on this single metric, Company A appears to be more reasonably priced than Company B.
Things to Watch Out For
A common pitfall is comparing the P/E ratios of companies in completely different industries. A technology company expected to grow rapidly will naturally have a much higher P/E than a stable utility company. Always compare P/E ratios of companies within the same sector.
The Key Takeaway
The P/E ratio is a quick-glance tool for judging if a stock is potentially overvalued or undervalued relative to its earnings and its peers.
Additional Topics to Explore
- Slippage: The specific problem that the stop-limit order is designed to solve.
- Understanding Support and Resistance: The Market’s Memory: Understanding Support and Resistance.
- Candlestick Patterns an Introduction: The Market’s Poetry.