
Summary (TL;DR)
The Volume-Weighted Average Price (VWAP) is not just another average. It represents the “true” average price of a stock over a specific time period (usually one day), calculated by factoring in the volume of shares traded at each price point. Traders use it as a benchmark to determine if their buy or sell orders were executed at a fair price relative to the market’s overall activity.
Introduction
In the vast ocean of the market, prices rise and fall like the tides. A stock might open at $100, touch $102, and close at $99. A simple average of these numbers gives you a vague sense of its journey, but it misses the most crucial detail: where did the real action happen? Did millions of shares trade at the high point, or was it a fleeting peak with little interest? The Volume-Weighted Average Price, or VWAP, answers this question. It acts as a financial compass, pointing to the price level where the most significant volume the true weight of market opinion was exchanged.
A Look Back in Time
The concept of VWAP was not born in a university lecture hall but forged in the fast-paced world of institutional trading. Before the era of high-speed electronic trading, large funds faced a significant challenge: how to buy or sell massive blocks of stock without causing the price to skyrocket or plummet. They needed a benchmark to measure the quality of their trades throughout the day. VWAP emerged as the solution, a dynamic measuring stick that became indispensable with the rise of algorithmic trading systems designed to execute large orders discreetly and efficiently.
The Core Concept (Explained with Analogy)
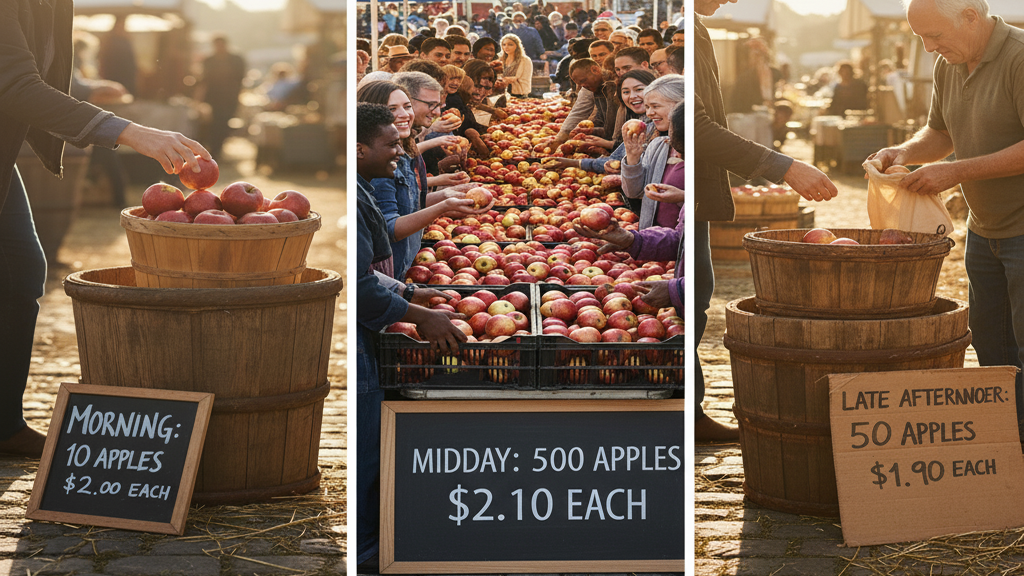
Imagine a farmer’s market where a specific type of apple is being sold.
- In the morning, when the apples are fresh, a few early birds buy 10 apples at $2.00 each.
- By midday, the crowd arrives. The farmer, seeing high demand, sells 500 apples at $2.10 each.
- Late in the afternoon, to clear out the remaining stock, the farmer sells the last 50 apples at $1.90 each.
A simple average of the prices ($2.00, $2.10, $1.90) would be $2.00. But is that the true average price paid for an apple that day? Not at all. It ignores the fact that the vast majority of sales happened at $2.10.
VWAP is like finding the true average price paid. It gives more weight to the price where the most apples were sold. The calculation would look at the total money spent () and divide it by the total apples sold (560). The VWAP would be approximately $2.08, which is much closer to $2.10 the price where the real action was. In the stock market, “apples” are shares and the “number of apples sold” is the volume.
A Real-World Connection
Consider a massive mutual fund, like one managed by Vanguard or Fidelity, that needs to invest millions of dollars into shares of a company like Microsoft (MSFT). If they were to place one giant “buy” order, they would signal their intent to the entire market, and the price would likely surge before their order was filled, resulting in a poor average price. Instead, their sophisticated trading algorithms break the large order into thousands of smaller ones throughout the day. The primary goal of these algorithms is often to execute the total order at a final average price that is at or below the day’s VWAP, proving they achieved a fair and efficient execution for their investors.
From Theory to Practice
Traders and investors use VWAP to answer several key questions:
A Brief Illustration
Let’s assume a stock has three trades in the first minute of trading:
- Trade 1: 200 shares are traded at $50.00
- Trade 2: 500 shares are traded at $50.10
- Trade 3: 300 shares are traded at $50.05
To calculate the VWAP, we use the formula:
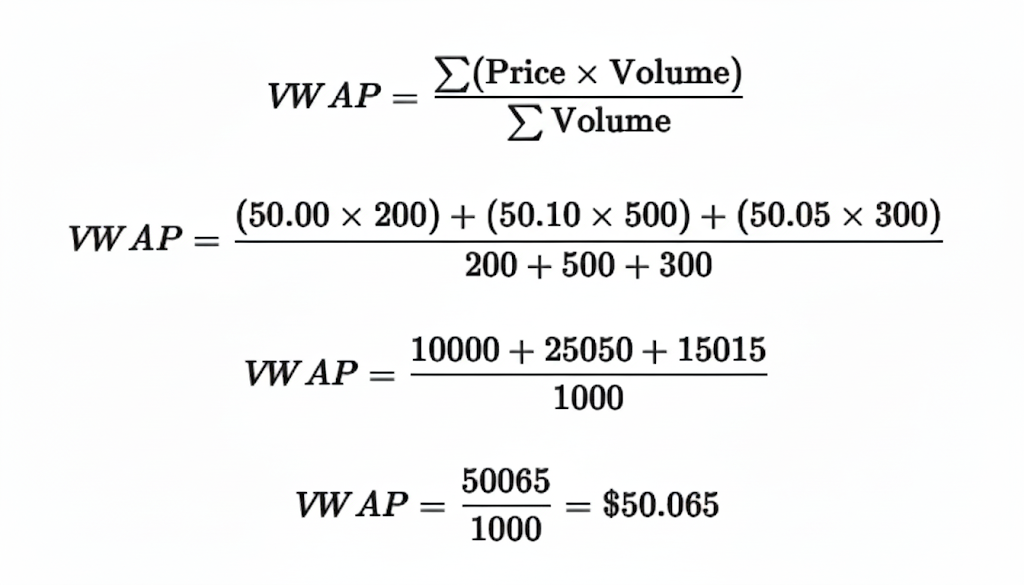
The VWAP for this period is $50.065, a much more accurate reflection of the “average” price than a simple average of the three trade prices.
The Chapter’s Wisdom (Key Takeaways)
- VWAP is a benchmark, not a predictor. It tells you the average price relative to volume that has already occurred.
- Volume is the key ingredient. It distinguishes VWAP from simple moving averages by placing emphasis where the most trading activity happens.
- It is an intraday tool. The VWAP calculation starts fresh every trading day at the market open and is most relevant during that single day.
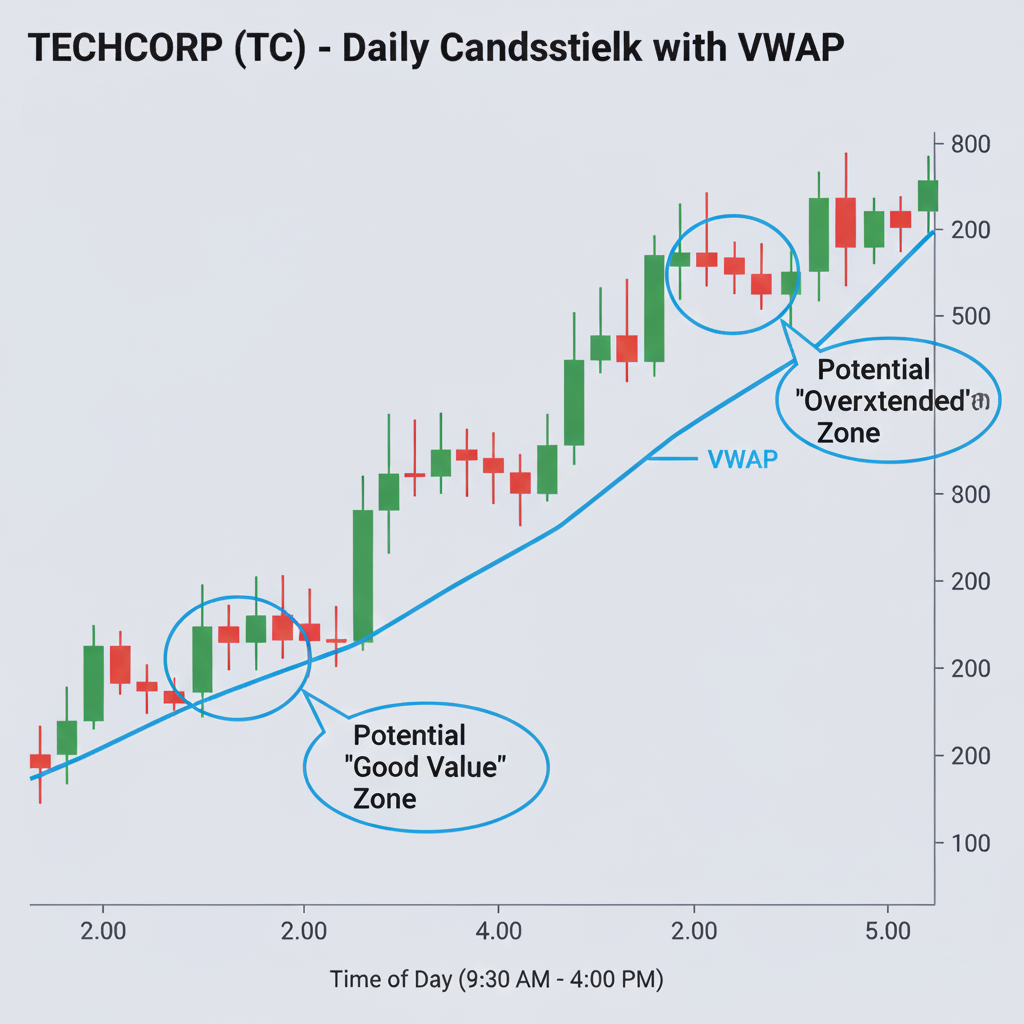
- Context is crucial. A stock trading above VWAP is not an automatic “sell” signal. It must be interpreted in the context of the overall market trend and other indicators.
Chapter Glossary
- Volume-Weighted Average Price (VWAP): The average price of a security for a given period, weighted by the volume traded at each price point.
- Volume: The total number of shares or contracts exchanged between buyers and sellers of a security during a given period.
- Liquidity: The degree to which an asset can be quickly bought or sold in the market at a price reflecting its current value.
- Intraday: Occurring within a single trading day.
- Benchmark: A standard or point of reference against which things may be compared or assessed.
Food for Thought (Engagement Prompt)
- If VWAP is used by so many institutional algorithms as a benchmark, could it become a self-fulfilling prophecy, causing price to react simply because it’s approaching the VWAP line?
- How might the usefulness of VWAP differ when analyzing a low-volume, thinly-traded stock versus a high-volume, liquid stock like Apple (AAPL)?
Additional Topics to Explore
- VWAP vs. Moving Averages: The Anchor and the River: A Tale of VWAP and Moving Averages.
- Bollinger Bands: A Beginner’s Guide to Bollinger Bands – The River of Price.
- Relative Strength Index (RSI): Intro to the Relative Strength Index (RSI): The Engine’s Tachometer.
- RSI & Moving Averages: A System for Combining Moving Averages and RSI.