


Summary (TL;DR)
The Relative Strength Index (RSI) is a momentum oscillator that measures the speed and magnitude of price changes. It operates on a scale from 0 to 100, helping traders identify potentially “overbought” conditions (typically above 70) and “oversold” conditions (below 30). Its most powerful feature is its ability to reveal divergences, where momentum and price move in opposite directions, often signaling a potential trend reversal.
Introduction
In our previous discussions, we explored moving averages, which act like a river’s current, showing us the general direction of the trend. But what about the force of that current? Is it a raging torrent or a lazy stream? To answer this, we need a different kind of instrument. The Relative Strength Index, or RSI, is that instrument. It is not concerned with the trend’s direction but with its momentum—its internal strength and enthusiasm. The RSI is the market’s tachometer, revealing how hard the engine is working behind a price move.
A Look Back in Time
The RSI was introduced to the world by a brilliant technical analyst and mechanical engineer named J. Welles Wilder Jr. in his seminal 1978 book, New Concepts in Technical Trading Systems. In an era before the click of a mouse could summon any indicator, Wilder developed his tools, including the RSI, through painstaking manual calculation. Its enduring popularity is a testament to its robust and elegant design, which has remained a staple in the analyst’s toolkit for decades.
The Core Concept (Explained with Analogy)
To truly understand the RSI, imagine you are driving a car.
The car’s speed is the stock’s price. It tells you how fast you are going right now.
The car’s tachometer (RPM gauge) is the RSI. It tells you how hard the engine is working to produce that speed.
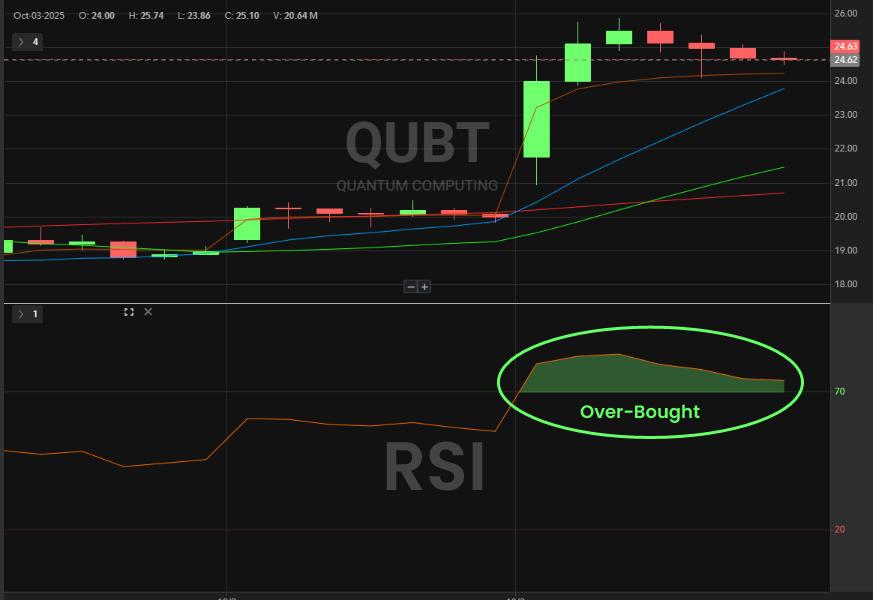
Overbought (RSI > 70): You’re flooring the gas pedal, and the tachometer is in the red zone. The car is moving fast, but the engine is straining and cannot maintain this intensity forever. It might need to cool down soon. This is an “overbought” condition the buying momentum is intense, perhaps unsustainably so.
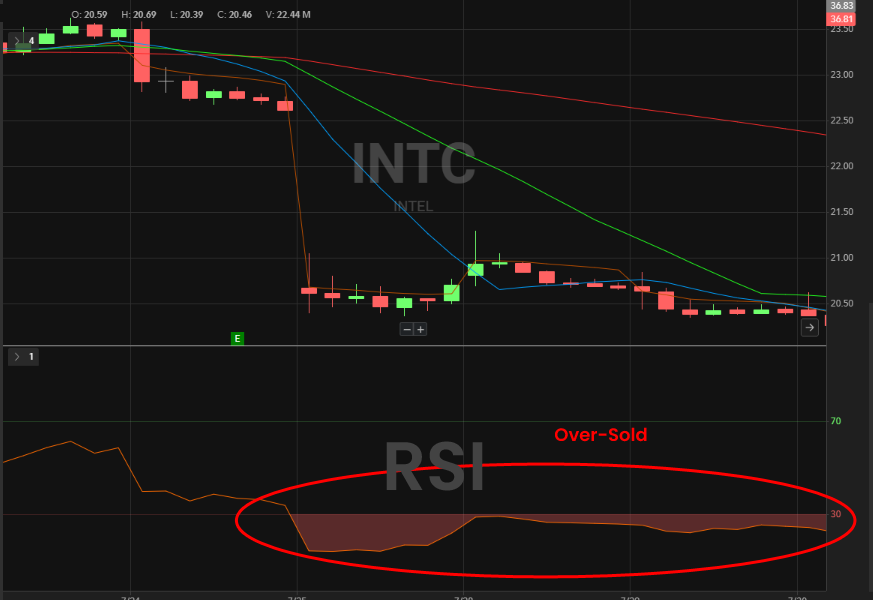
Oversold (RSI < 30): The engine is sputtering at very low RPMs. There’s little power or conviction. From this state, it’s easier for the driver to shift gears and accelerate again. This is an “oversold” condition selling pressure has been heavy, and the asset may be running out of sellers.
The most profound insight comes when the speedometer and tachometer tell different stories. This is called divergence.
- Bearish Divergence: The speedometer shows your speed is still climbing (the stock hits a new high), but you notice the tachometer is showing lower RPMs than before (the RSI makes a lower high). This is a critical warning: despite the higher speed, the engine is losing power. A slowdown may be imminent.
- Bullish Divergence: You’ve slowed to a new low speed (the stock hits a new low), but the tachometer shows the engine’s RPMs are higher than they were at the previous low (the RSI makes a higher low). This suggests that even though the car is going slower, the engine is building power, ready to accelerate.
A Real-World Connection
Consider the historic bull run of Bitcoin at the end of 2017. As the price rocketed towards $20,000, each new peak in price was met with wild enthusiasm. However, a technical analyst watching the daily chart would have noticed a classic bearish divergence. While the price made a spectacular new high in mid-December, the RSI indicator made a significantly lower high than it had on a previous, lower peak. The “speed” was increasing, but the “engine’s RPMs” were falling. This signaled that the buying momentum was becoming exhausted. Shortly after, the price began its dramatic, multi-month crash.
From Theory to Practice
- The 70/30 Framework: The default RSI settings use 70 as the overbought threshold and 30 as the oversold threshold. These are not rigid rules but rather zones of interest. When the RSI enters these zones, it’s a signal to pay closer attention.
- An Essential Nuance: A common mistake is to sell immediately when RSI crosses 70 or buy when it crosses 30. In a powerful, sustained uptrend, an asset’s RSI can remain “overbought” for a very long time. These levels are not automatic triggers; they are alerts that momentum is reaching an extreme.
- Spotting Divergence: This is the RSI’s most predictive feature. To spot it, you must compare the peaks and valleys on the price chart to the peaks and valleys on the RSI indicator below it.
- To find Bearish Divergence: Look for two major peaks. Is the second price peak HIGHER than the first? Now look at the RSI. Is the second RSI peak LOWER than the first? If so, you have bearish divergence.
- To find Bullish Divergence: Look for two major valleys. Is the second price valley LOWER than the first? Now look at the RSI. Is the second RSI valley HIGHER than the first? If so, you have bullish divergence.
Let’s imagine a stock, “Innovate Corp,” is in a downtrend.
- In June, it hits a low of $50, and the RSI indicator hits a low of 22.
- The stock bounces a little, then falls again over the next month.
- In July, it makes a new, lower low at $47. Many would see this as continued weakness.
- However, you look at the RSI, and at this $47 price low, the RSI only falls to 35.
The price made a lower low ($47 vs $50), but the RSI made a higher low (35 vs 22). This is a classic bullish divergence, signaling that the downward selling momentum is fading and a reversal could be near.
The Chapter’s Wisdom (Key Takeaways)
- RSI measures momentum, not price. It gauges the internal strength and speed of the market’s advance or decline.
- Overbought and oversold are warning zones, not sell or buy signals. They alert you that momentum is at an extreme, which requires closer analysis, not a blind reaction.
- Divergence is the key. When the RSI disagrees with the price, it is often providing a valuable clue that the current trend is losing its conviction.
Chapter Glossary
- Relative Strength Index (RSI): A technical momentum indicator that compares the magnitude of recent gains to recent losses to evaluate overbought or oversold conditions.
- Momentum: The rate of acceleration of a security’s price or volume.
- Oscillator: An indicator that moves back and forth between two extreme values, providing signals as it nears one of the extremes.
- Overbought / Oversold: Conditions in which an asset’s price has risen or fallen sharply and is susceptible to a reversal.
- Divergence: A situation where the price of an asset is moving in the opposite direction of a technical indicator, like the RSI.
Food for Thought (Engagement Prompt)
- If an asset’s RSI can remain “overbought” (above 70) for weeks in a strong uptrend, how might this information be useful to a trend-following investor, rather than just someone looking for a place to sell?
- If you spotted a clear bullish divergence on a stock’s daily chart, what other indicator or signal (perhaps one we’ve discussed in previous chapters) might you look for to confirm your thesis before buying?
Additional Topics to Explore
- The Price to Earnings (P/E) Ratio: Definition of the Price to Earnings (P/E) Ratio
- Volume-Weighted Average Price (VWAP): Understanding the VWAP – The True Price of the Day.
- VWAP vs. Moving Averages: The Anchor and the River: A Tale of VWAP and Moving Averages.
- Bollinger Bands: A Beginner’s Guide to Bollinger Bands – The River of Price.
- RSI & Moving Averages: A System for Combining Moving Averages and RSI.