


Summary (TL;DR)
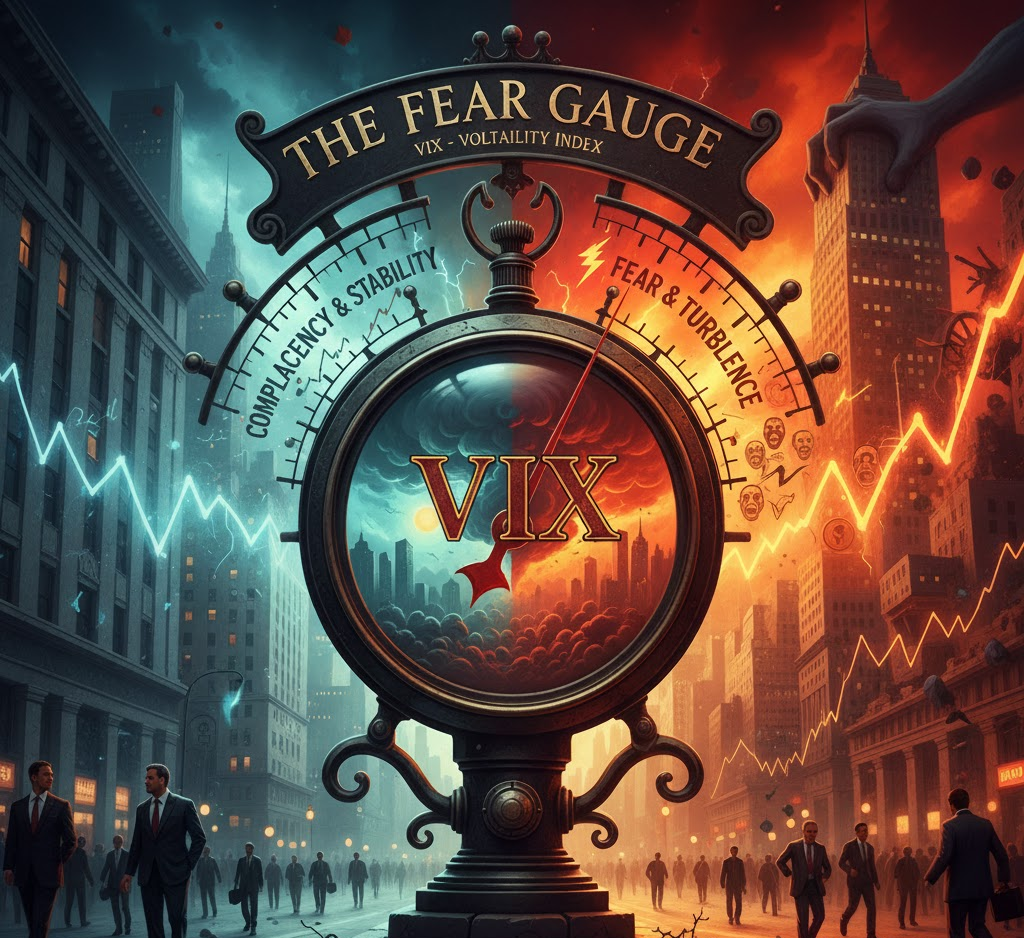
The CBOE Volatility Index (VIX) is the market’s “fear gauge.” It does not measure price but rather the expectation of volatility over the next 30 days for the S&P 500. It does this by tracking the price of options. A low VIX signals investor complacency and market stability, often seen during uptrends. A high VIX signals intense fear and the expectation of wild price swings, typically occurring when the market falls.
Introduction
Thus far, our journey has focused on instruments that analyze the market’s movements—its trends, momentum, and price action. But what if we could measure the market’s emotional state? What if we could take a reading of its collective pulse? The Volatility Index, or VIX, allows us to do just that. It is a unique and powerful indicator that quantifies fear and complacency, giving us a real-time window into the market’s psyche. While moving averages and the RSI track the body’s actions, the VIX reads the mind.
A Look Back in Time
The quest to measure market expectations led the Chicago Board Options Exchange (CBOE) to introduce the VIX in 1993. Based on the pioneering academic work of Professor Robert Whaley, the index was initially calculated using options on the S&P 100 index. A decade later, in 2003, the methodology was updated to use the broader S&P 500 index, making it a more accurate reflection of the overall U.S. stock market. This modern iteration of the VIX quickly became the global benchmark for stock market volatility.
The Core Concept (Explained with Analogy)
To understand the VIX, imagine the market is a collection of valuable beachfront homes (the S&P 500). The VIX itself is the average price of hurricane insurance for these homes.
- When the weather is beautiful and the forecast is clear for months on end (a calm, rising stock market), nobody is worried about a storm. The demand for hurricane insurance is low, and therefore the price of a policy is very cheap. This is a low VIX. Homeowners are complacent.
- Suddenly, a storm watch is issued. A major hurricane appears on the horizon (a potential financial crisis or negative economic report). Homeowners panic. Everyone rushes to buy insurance at the exact same time. This massive surge in demand causes the price of insurance policies to skyrocket. This is a high VIX.
Crucially, the price of insurance doesn’t spike because the hurricane has already hit. It spikes based on the perceived risk and fear of the hurricane hitting in the near future. The VIX is a forward-looking measure of fear, not a backward-looking report of damage.
A Real-World Connection
No event illustrates the VIX’s role as a panic meter better than the COVID-19 market crash. In February 2020, the VIX was in the “calm zone,” trading in the low teens. As the global pandemic took hold in March, the S&P 500 plummeted in one of the fastest crashes in history. In response, the VIX exploded, reaching a record closing high of 82.69 on March 16, 2020. This showed that the “cost of insurance” had reached unprecedented levels, reflecting a state of absolute panic and extreme uncertainty about the future.
From Theory to Practice: Decoding the Levels
The VIX is quoted in percentage points. A reading of 25 implies an expected annualized volatility of 25%. Here is a general guide to interpreting its levels:
- Above 40 (The Panic Zone): This signals extreme, often irrational, fear. It is a landscape of crisis, panic-selling, and capitulation. While terrifying, these extreme peaks in the VIX have historically occurred near major market bottoms.
- 30-40 (The Fear Zone): This indicates significant fear and uncertainty. The market is typically in a sharp correction or downtrend, with large and unpredictable daily price swings.
- 20-30 (The Zone of Concern): This is where nervousness becomes palpable. A VIX above 20 suggests that risk is elevated and investors are growing anxious. The market is often turbulent and volatile in this range.
- Below 20 (The Calm Zone): This is the market’s “business as usual” state. It reflects low expected volatility, stability, and investor confidence. Extended periods of a low VIX are hallmarks of steady bull markets. However, a VIX reading below 12 can suggest extreme complacency, making the market vulnerable to shocks.
A Brief Illustration
Imagine in July, the stock market is in a stable uptrend, and the VIX is hovering at a low level of 14. In August, an unexpected crisis in the banking sector emerges. As fear grips the market, the S&P 500 drops 10% in two weeks. In response to the panic and uncertainty, investors flood the options market seeking protection. This surge in demand for “insurance” causes the VIX to spike from 14 to 38, reflecting the radical shift from complacency to fear.
The Chapter’s Wisdom (Key Takeaways)
- It is Forward-Looking: Unlike most indicators, the VIX does not use past prices in its calculation. It is a real-time measure of future expectations.
- Inverse Correlation is Key: The VIX’s most reliable characteristic is its tendency to move opposite to the S&P 500. When stocks fall, the VIX rises, and vice-versa.
- It is Mean-Reverting: The VIX will not stay in a state of panic (high levels) or complacency (low levels) forever. It tends to revert to its long-term average over time.
- It Measures Implied Volatility: The VIX reflects the perceived risk priced into options, not the actual, realized volatility of the market.
Chapter Glossary
- VIX (Volatility Index): The ticker symbol for the CBOE Volatility Index, which measures the 30-day expected volatility of the S&P 500.
- Volatility: The degree of variation of a trading price series over time, often measured by standard deviation. High volatility means large price swings.
- Options (Put/Call): Financial contracts that give the buyer the right, but not the obligation, to buy (call) or sell (put) an underlying asset at a specified price on or before a certain date.
- Inverse Correlation: A relationship between two variables in which they move in opposite directions.
- Mean Reversion: A theory suggesting that asset prices and historical returns eventually revert to their long-term mean or average level.
Food for Thought (Engagement Prompt)
- If the VIX is a “fear gauge,” what might it signify if the stock market experiences a slow, grinding decline over several months, but the VIX never spikes into the “Panic Zone”?
- Knowing that the VIX is mean-reverting, some traders try to “short” the VIX when it reaches extreme highs. What are the potential benefits and significant dangers of such a strategy?
Additional Topics to Explore
- Relative Strength Index (RSI): Intro to the Relative Strength Index (RSI): The Engine’s Tachometer.
- The Price to Earnings (P/E) Ratio: Definition of the Price to Earnings (P/E) Ratio.
- Trailing Stop Order: The Rising Shield: Mastering the Trailing Stop Order.
- Volume: The number of shares traded during the period.
- Volume Analysis: How trading volume can be used to confirm the strength of a candlestick pattern.