


Understanding the Language of the Market
Summary (TLDR)
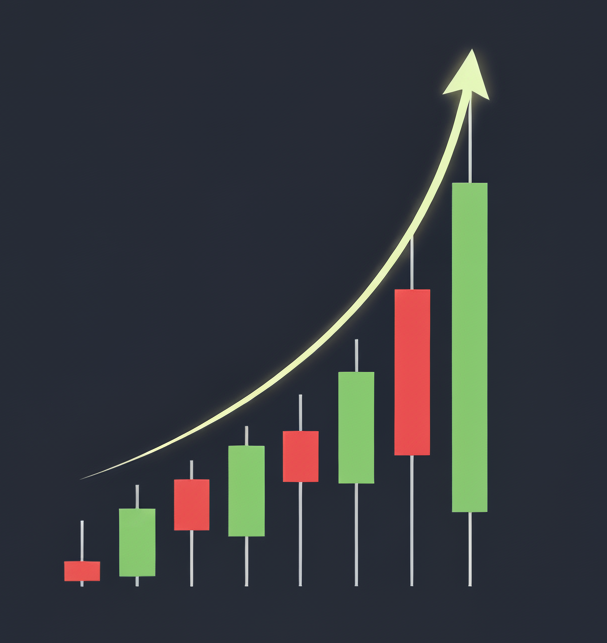
A candlestick is a visual representation of price action over a specific time period, revealing the opening, closing, high, and low prices and providing a quick, at-a-glance summary of market sentiment.
Introduction
The language of the market is not spoken, but drawn. Every tick, every transaction, every moment of indecision or conviction is etched into the chart. Among the many dialects of this language, the candlestick is one of the most eloquent. Originating centuries ago in the rice markets of Japan, these simple shapes are not merely data points; they are stories told in a single glance, encapsulating the entire narrative of a trading period.
The Core Concept (Explained Simply)
Imagine you are a historian documenting a single, pivotal day. You don’t just write down the final outcome; you describe the journey. Where did the day begin? Where did it end? What was the highest point of drama, and what was the lowest point of despair?
A candlestick is that historian’s account for a single time period, be it a minute, an hour, or a day. It is composed of two primary parts: the body and the wicks (or shadows).
The body of the candle tells the main story. It is the wide, rectangular part that shows the distance between the opening price and the closing price. If the body is green (or white), it signifies that the price closed higher than it opened—a day of progress, a bull’s victory. If the body is red (or black), the opposite is true; the price closed lower than it opened—a day of retreat, a bear’s dominance.
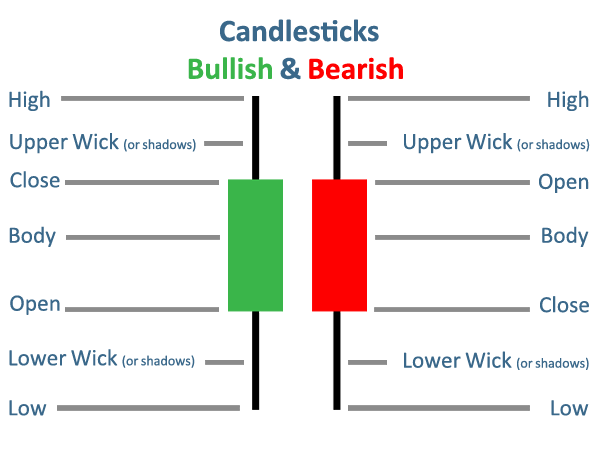
The thin lines extending from the top and bottom of the body are the wicks or shadows. These are like the dramatic footnotes of the day. The upper wick shows the highest price reached during the period, while the lower wick reveals the lowest. They show the full range of the battle, even if the price couldn’t hold those extremes. A long upper wick might suggest that buyers attempted to push the price higher but were ultimately rejected, while a long lower wick could show that sellers tried to push the price down but were met with strong buying pressure.
From Theory to Practice
Traders do not look at a single candlestick in isolation; they read them in context, as words forming a sentence. The length of the body, the size of the wicks, and the relationship between consecutive candles all provide clues about market psychology.
- Long bodies indicate strong conviction from either buyers or sellers.
- Small bodies suggest indecision or a period of consolidation where neither side is in control.
- Long wicks signal price rejection and can warn of a potential trend reversal. For example, a “hammer” or “shooting star” pattern, with its long wick and small body, is a potent visual signal.
By observing these patterns, traders can begin to answer critical questions: Is the current trend weakening? Is a potential reversal on the horizon? Is there a struggle between buyers and sellers?
A Brief Illustration
Imagine a single day on a stock chart. The stock opens at $50. Over the course of the day, it rises to a high of $55, but by the closing bell, it has retreated slightly to $53. It never dropped below its opening price. The resulting candlestick would be green, with its body stretching from $50 to $53, and a single upper wick extending from $53 to $55. This tells the story of a positive day where buyers were in control, even if they couldn’t hold onto the day’s absolute peak.
Why It Matters
- A candlestick visually represents four key prices: open, high, low, and close.
- The body shows the relationship between the open and close, indicating whether the price rose (green/white) or fell (red/black).
- The wicks reveal the highest and lowest points reached during the period, showing the full range of price action.
- By combining multiple candlesticks into patterns, traders can interpret market sentiment and anticipate potential shifts.