


The Market’s Pulse: Understanding Volume
Summary (TLDR)
Volume is the total number of shares or contracts traded for a security over a specific time period. It is the “fuel” of a market move, confirming the strength and conviction behind a change in price.
Introduction
Every chart tells a story of price, but without a sense of its intensity, the story is incomplete. If price is the voice of the market, then volume is the loudness of that voice. It is the measure of participation, the tally of all transactions, and a critical window into the conviction and interest of the buyers and sellers shaping the market. Volume reveals whether a price movement is a small whisper between a few players or a thunderous consensus among the masses.
The Core Concept (Explained Simply)
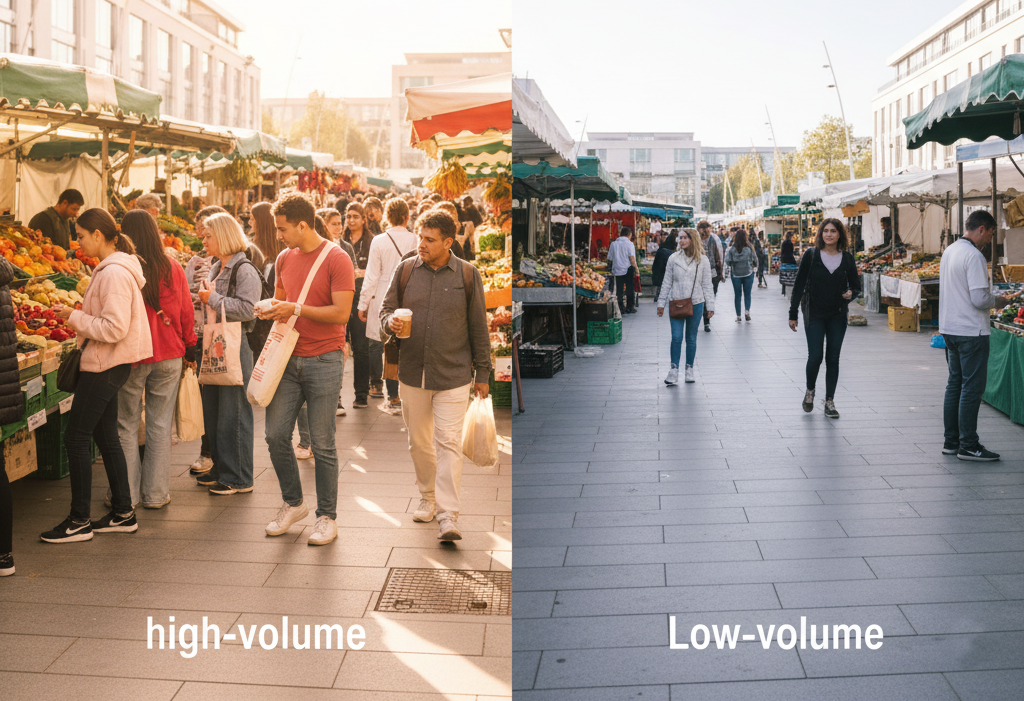
Imagine a town square where an item is being sold. The item’s price fluctuates based on what people are willing to pay, but the true interest in the item is measured by how many people are actually buying and selling it.
Volume is the count of those transactions. A high-volume day is like a bustling, crowded marketplace where a great many people are actively trading. This high activity suggests a strong, widespread interest in the security. A low-volume day, conversely, is like an empty square with only a few people trading. This lack of activity signals indecision or a general disinterest in the security.
When the price of the item rises, the volume tells you if that rise is being driven by a few enthusiastic buyers or a large, committed crowd. It is the raw measure of market activity, and without it, you are only seeing half the picture.
From Theory to Practice
Traders use volume not as a standalone signal, but as a crucial confirming tool. It adds a layer of depth to price analysis, helping to filter out false signals and validate the strength of a trend. The most fundamental principles of volume analysis are:
- Confirmation: A strong price move, whether up or down, is considered more reliable and likely to continue if it is accompanied by high trading volume. High volume validates the move, showing that many market participants are a part of it.
- Divergence: A dangerous sign is when a price move is not confirmed by volume. For example, if a stock’s price is rising but its volume is steadily decreasing, it suggests that the rally is weak and lacks conviction. This can often be a prelude to a reversal.
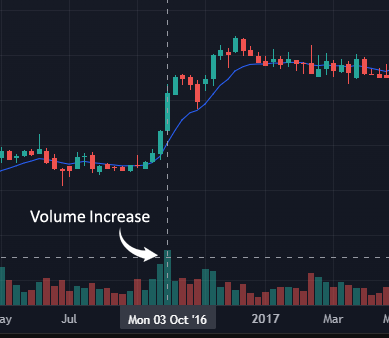
- Reversal Signals: A sudden, significant spike in volume can sometimes signal the end of a trend. A high-volume day during a strong uptrend or downtrend can indicate a “climax,” where the last of the buyers or sellers have entered the market, and the trend may be nearing exhaustion.
Traders often visualize volume as a series of vertical bars at the bottom of their price charts, with a taller bar representing a higher volume for that period.
A Brief Illustration
Let us consider a stock that has been steadily moving higher. One day, it suddenly jumps 5% in price, but the vertical volume bar on the chart is very short, far below its recent average. This tells the discerning trader that while the price moved up, it was not a widely supported move. It was likely driven by a few large trades, and a lack of broad interest could mean that the price increase is fragile and unsustainable.
In contrast, if that same 5% jump in price was accompanied by a huge, towering volume bar—the tallest in weeks—it would signal a powerful, convicted move. This would tell the trader that a great many people believe in the stock’s future and are actively buying, suggesting the uptrend is healthy and likely to continue.
Why It Matters
- Gauging Conviction: Volume is the primary measure of the strength and enthusiasm behind a price move.
- Validating Trends: High volume confirms the legitimacy of a trend, while low volume warns of a potential lack of interest or a pending reversal.
- Filtering Signals: By using volume as a filter, traders can avoid entering trades based on weak price movements or “head fakes” that are not supported by genuine market participation.
Additional Topics to Explore
- Understanding Support and Resistance: The Market’s Memory: Understanding Support and Resistance.
- Volume Analysis: Reading the Market’s Footprints: The Art of Volume Analysis
- The Ask & The Bid: The Market’s Conversation: Understanding the Bid and the Ask