


Reading the Market’s Footprints: The Art of Volume Analysis
Summary (TLDR)
Volume analysis is the method of assessing the health of a price trend by examining the number of shares traded. High volume confirms the strength and conviction behind a price move, while low volume suggests a lack of interest and potential weakness.
Introduction
The price chart tells you where the market has been, but it doesn’t always tell you how determined it was to get there. To understand that, you must look beneath the price to the energy that fuels its every move. Volume analysis is the art of studying this energy. It is the practice of interpreting the market’s conviction by measuring its participation. By analyzing volume alongside price, a trader can begin to distinguish between a half-hearted gesture and a powerful, committed march.
The Core Concept (Explained Simply)
Imagine you are a tracker following a path along a sandy beach. The direction of the footprints tells you which way the traveler is going—this is the price. But the footprints hold more clues. Are they shallow and scattered, as if made by a single person meandering aimlessly? Or are they deep, numerous, and close together, indicating a large, heavy group moving with purpose?
Volume analysis is the art of studying the depth and number of those footprints.
- A price move on low volume is like a few shallow prints in the sand. The path is there, but there’s little weight or conviction behind it. The traveler could easily turn back.
- A price move on high volume is like a wide trail of deep, clear footprints. It shows that a large, determined group is on the move. This path has significance, and the direction is more likely to be sustained.
By observing both the direction (price) and the intensity (volume) of the market’s activity, you can better judge the true strength and intention behind a trend.
From Theory to Practice
Traders use volume analysis not to predict the future, but to confirm the present. It is a foundational skill that validates what price is doing. The core principles are:
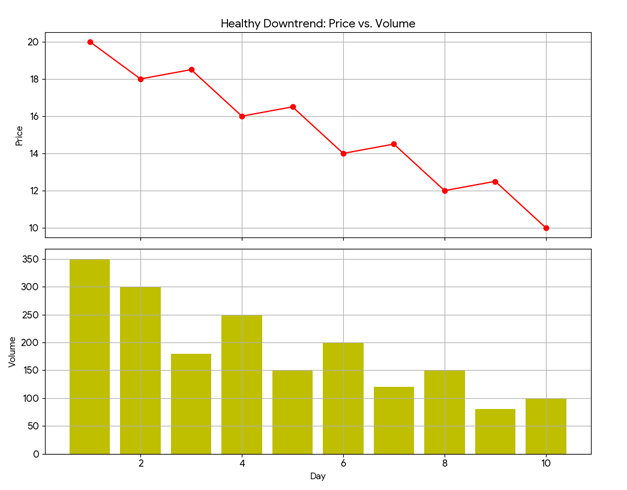
- Trend Confirmation: This is the most basic and vital rule. In a healthy uptrend, volume should generally increase as prices rise and decrease as prices pull back. In a healthy downtrend, volume should increase as prices fall and decrease on minor bounces. This shows the dominant group (buyers in an uptrend, sellers in a downtrend) is engaged.
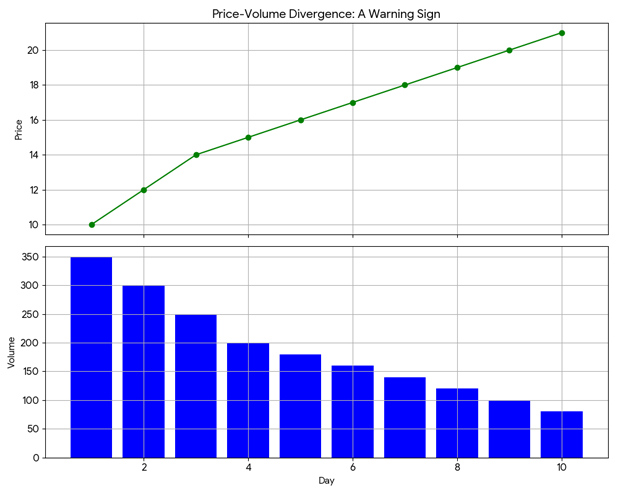
- Divergence (A Warning Sign): Divergence occurs when price and volume move in opposite directions, signaling potential weakness. If a stock’s price is grinding higher to new highs but the volume on each subsequent push is lower and lower, it’s a major red flag. 🚩 This suggests enthusiasm is waning, and the trend is running on fumes, making it vulnerable to a reversal.
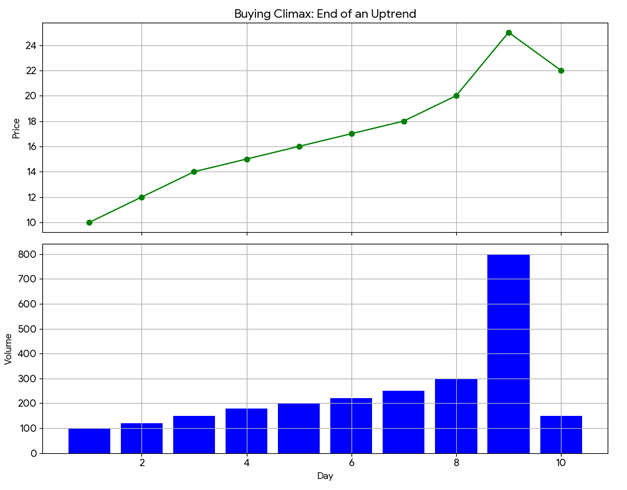
- Exhaustion (Climax): A sudden, massive spike in volume after a long trend can signal its end. A buying climax happens at the end of an uptrend, where a sharp price increase on huge volume signifies the last wave of euphoric buyers getting in just as smart money sells to them. A selling climax is the inverse, marking a potential bottom.
A Brief Illustration
Consider a stock that has been trading sideways in a range between $45 and $50 for weeks. One day, it suddenly moves to $51 on a massive surge of volume—five times its daily average.
A trader using volume analysis sees this not just as a price move, but as a high-volume breakout. The immense volume suggests that a large number of participants (likely institutions) are buying with conviction, confirming the breakout’s strength. Conversely, if the stock had crept to $51 on very light, below-average volume, the trader would be highly skeptical, viewing it as a weak move that is likely to fail and fall back into the range (a “fakeout”).
Why It Matters
- Reveals Conviction: Volume analysis provides a window into the conviction and emotional commitment behind price movements.
- Confirms Signals: It is one of the most effective tools for confirming the strength of a trend, a breakout, or a reversal pattern.
- Spots Weakness: It helps traders identify weakening trends and avoid “fakeouts” by showing when a price move lacks broad market participation.
Additional Topics to Explore
- Volume: The number of shares traded during the period, which adds context to the strength of a move shown by a candlestick.
- Relative Volume (RVOL): The comparison of current volume to a stock’s average volume, used to spot unusual activity.
- Candlestick Patterns an Introduction: Specific sequences of candles that often predict future price movements (e.g., Doji, Engulfing, Hammer)