


Summary OTC (Over-the-Counter) trading is a decentralized way of buying and selling financial instruments directly between two parties, bypassing a…

Understanding Barbell Rotation: The Two-Hulled Ship
A barbell strategy is an investment approach that focuses on two opposite extremes, such as high-risk growth assets and ultra-safe…

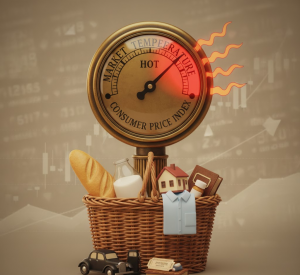
Understanding the Consumer Price Index (CPI): The Market’s Thermostat
The Consumer Price Index (CPI) is a vital economic indicator that measures the average change in prices paid by consumers…

A Deep Dive into Moving Averages (EMA & SMA)
Moving averages are fundamental tools that smooth out price data to reveal the underlying trend, much like a filter clarifies…
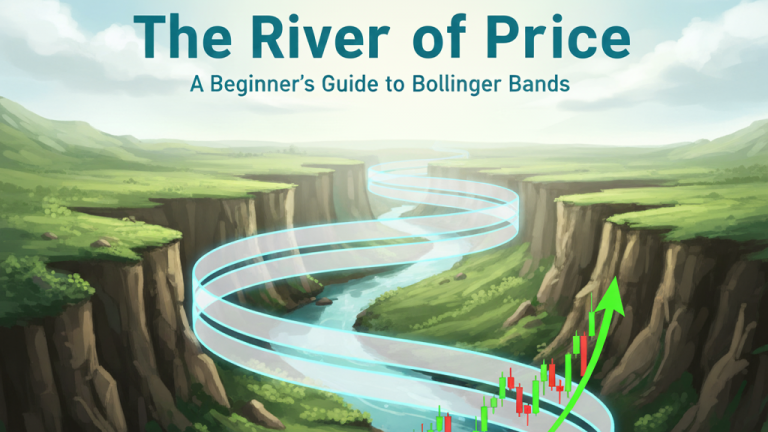
The River of Price: A Beginner’s Guide to Bollinger Bands
Summary (TL;DR) Bollinger Bands are three lines drawn on a financial chart that act as a dynamic channel around a…
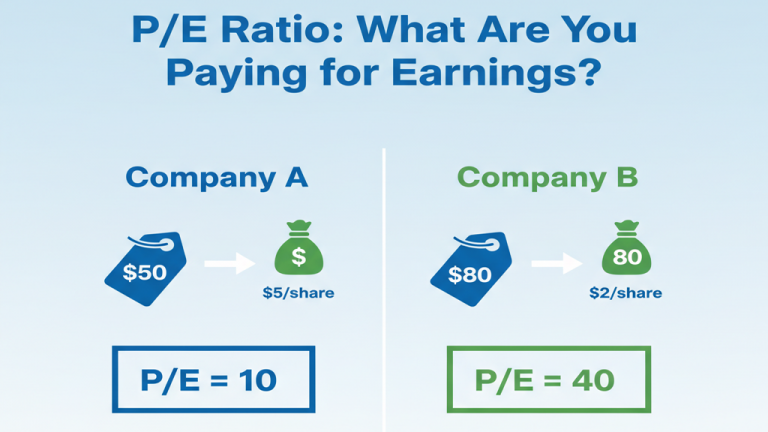
The Price to Earnings (P/E) Ratio
The Price-to-Earnings (P/E) ratio is a simple valuation metric that tells you how expensive a company's stock is relative to…

Mastering Dollar-Cost Averaging (DCA) – The Investor’s Rhythm
Dollar-Cost Averaging (DCA) is the disciplined strategy of investing a fixed amount of money at regular intervals—for example, $100 every…

The Market’s Hour of Power: Understanding Triple Witching
Triple Witching is a specific day that occurs four times a year when three types of financial contracts all expire…
Understanding Market Breadth: The Army and Its Generals
Market breadth is like a headcount of the stock market. Instead of just watching the headline index (like the S&P…
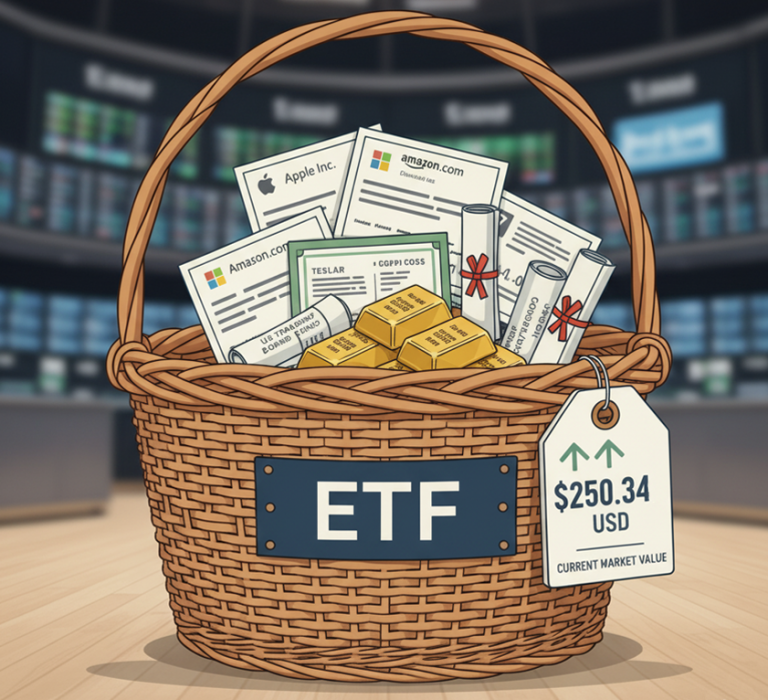
The Investment Basket: Understanding Exchange-Traded Funds (ETFs)
An Exchange-Traded Fund, or ETF, is a type of investment fund that holds a collection of assets—like stocks, bonds, or…