


The Market’s Poetry
Summary (TLDR)
Candlestick patterns are formations of one or more candles that can signal a potential continuation or reversal of a market trend. They provide a visual shortcut for understanding market psychology and the balance of power between buyers and sellers.
Introduction
If a single candlestick is a word in the market’s language, then a candlestick pattern is a phrase or a line of poetry. It’s the sequence that gives the words their true meaning. A lone candle tells the story of a single period, but when you string them together, they begin to tell a much larger tale—of struggle, of triumph, of exhaustion, and of potential change. Learning to read these patterns is like learning to read the market’s intentions.
The Core Concept (Explained Simply)
Imagine you are building with blocks. One block by itself doesn’t tell you much. But if you place a small block, then a slightly smaller one, and then a very large one next to them, you have created a pattern. You can see a progression and a change.
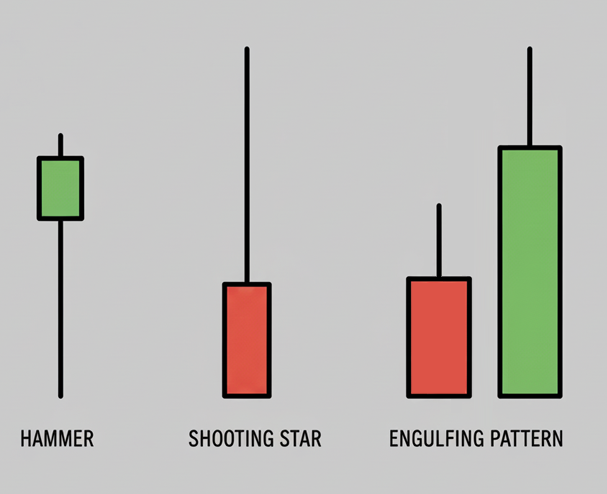
Candlestick patterns work the same way. They are recognizable shapes and sequences formed by groups of candlesticks. Traders have identified dozens of these patterns over the centuries, giving them evocative names like “Hammer,” “Shooting Star,” or “Engulfing Pattern.” Each one tells a specific story about the battle between buyers (bulls) and sellers (bears).
These patterns generally fall into two categories:
- Reversal Patterns: These suggest that the current trend is losing steam and may be about to change direction. For example, after a long fall in price (a downtrend), a powerful reversal pattern might appear, signaling that the sellers are exhausted and buyers are stepping in.
- Continuation Patterns: These indicate that the market is simply taking a brief pause before continuing in its current direction. Think of it as a moment to catch one’s breath before the next push.
The meaning of a pattern is not just in its shape, but also in its location. A “Hammer” pattern, for example, is only significant if it appears after a downtrend. The context is everything.
From Theory to Practice
Traders use these patterns as visual cues to make informed decisions. They are not foolproof prophecies, but rather indicators of probability—signals that the market’s sentiment may be shifting.
When a trader spots a pattern, they ask critical questions:
- What is the current trend? Is the price moving up, down, or sideways? The pattern’s meaning depends on this context.
- What story is the pattern telling? For example, a Bullish Engulfing Pattern, where a large green candle completely swallows the previous small red candle, tells a story of a dramatic and sudden shift in power from sellers to buyers.
- Is there confirmation? A savvy trader rarely acts on a pattern alone. They look for confirmation from the next candle or from other tools, such as trading volume, to validate the signal. A reversal pattern followed by a strong candle in the new direction is a much more powerful signal.
Famous patterns include the Doji (a sign of indecision), the Hammer and Hanging Man (potential reversals), and the Engulfing patterns (strong shifts in momentum).
A Brief Illustration
Consider a stock that has been falling for several days, creating a series of red candlesticks. Suddenly, a “Hammer” pattern appears. This candle has a short body at the top and a long lower wick.
The story this candle tells is that during the period, sellers managed to push the price significantly lower (the long wick), but before the period ended, buyers stormed back in, pushing the price all the way back up to near its opening level. This single candle shows a powerful rejection of lower prices. A trader seeing this might interpret it as a sign that the downtrend is weakening and prepare for a potential move higher, waiting for the next candle to confirm this new direction.
Why It Matters
- Visualizing Psychology: Candlestick patterns offer an immediate visual representation of market sentiment and the struggle between buyers and sellers.
- Identifying Turning Points: They are most powerful when used to spot potential trend reversals, allowing traders to anticipate changes in direction.
- Providing Entry and Exit Signals: Patterns can help traders decide when to enter a trade, where to place a stop-loss, and when to consider taking profits.
- Universality: These patterns are recognized and used by traders across the globe in all markets and timeframes.