In the fast-paced world of day trading, a clear understanding of specialized terminology is essential. This 2025 update compiles the most important day trading terms every beginner must know to navigate the markets. Familiarity with this vocabulary is the foundational step toward making informed trading decisions.
1. Bid/Ask Spread
The bid price represents the highest price a buyer is willing to pay for a security, while the ask price is the lowest price a seller is willing to accept. The difference between these two prices is the bid-ask spread. This spread is a direct reflection of a security’s liquidity and supply and demand. A narrow spread suggests a highly liquid asset with significant market participation, indicating that an order can be filled quickly and at a predictable price. Conversely, a wide spread is often seen in less liquid markets, where there are fewer buyers and sellers, and executing an order may lead to a higher cost.
2. Candlestick Chart
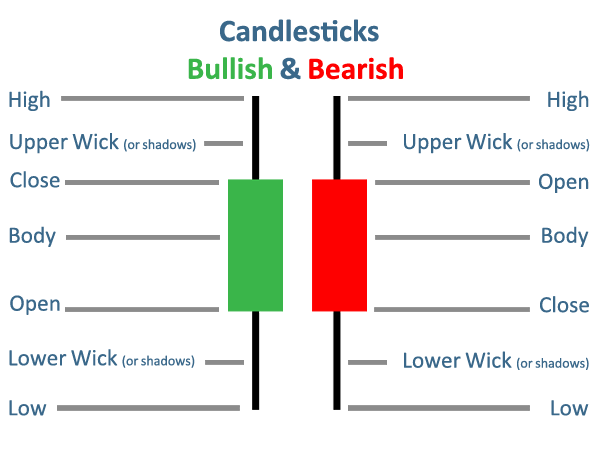
A candlestick chart is a type of financial chart used to describe price movements of a security over a specific period. Each “candlestick” provides a visual representation of four key data points: the opening price, the closing price, and the highest and lowest prices reached during that period. The body of the candle shows the range between the opening and closing prices, while “wicks” or “shadows” extend from the body to show the high and low. The color of the candle typically indicates whether the closing price was higher (green or white) or lower (red or black) than the opening price, offering an immediate snapshot of market sentiment.

3. Volume
Volume refers to the total number of shares, contracts, or units of a security that have been traded during a given timeframe. It is a critical indicator of market activity and the strength of a price movement. High volume often accompanies significant price changes, suggesting strong conviction among traders behind the move. Conversely, low volume during a price change may indicate a lack of widespread interest and a weaker trend.
4. Liquidity
Liquidity in financial markets refers to the ease with which a security or asset can be converted into cash without affecting its market price. A liquid market is characterized by a high number of active buyers and sellers and a narrow bid-ask spread. High liquidity is advantageous for day traders as it allows them to enter and exit positions quickly and at predictable prices, reducing the risk of slippage—where the execution price differs from the expected price. Illiquid assets, on the other hand, can be difficult to sell quickly and may require the seller to accept a significantly lower price.
5. Long/Short
These terms describe the direction of a trader’s position. Going long on a security means buying it with the expectation that its price will rise, allowing the trader to sell it later for a profit. This is the more traditional form of investing. Taking a short position, or “short selling,” involves borrowing a security and selling it in the open market, with the expectation of buying it back later at a lower price. The trader then returns the borrowed security, and the difference between the sale price and the buy-back price constitutes the profit.
6. Stop-Loss Order
A stop-loss order is an order placed with a broker to automatically sell a security when its price falls to a predetermined level. Its primary purpose is to limit a trader’s potential losses on a position. For example, a trader who buys a stock at $50 might place a stop-loss order at $48 to cap their loss at $2 per share. It becomes a market order once the stop price is hit, so the final execution price may be slightly different.
7. Limit Order
A limit order is an order to buy or sell a security at a specific price or better. A buy limit order will only be executed at the specified limit price or lower, ensuring the trader doesn’t overpay. A sell limit order will only be executed at the specified limit price or higher. Unlike a market order, which guarantees execution, a limit order guarantees the price but not necessarily the execution if the market doesn’t reach the specified price.
8. Market Order
A market order is an instruction to buy or sell a security immediately at the best available current market price. This type of order prioritizes speed of execution over a specific price. Market orders are most useful in highly liquid markets where the bid-ask spread is narrow, as the execution price is likely to be very close to the quoted price. However, in volatile or illiquid markets, a market order can result in an unexpected and unfavorable execution price.
9. Volatility
Volatility measures the degree of variation in a trading price over time. A security with high volatility experiences wide and rapid price fluctuations, which can present both significant profit opportunities and substantial risks for day traders. Traders often use volatility indicators to gauge market sentiment and identify potential trading opportunities. Low volatility suggests a more stable price, which may be less attractive to traders seeking to capitalize on short-term price movements.
10. Scalping
Scalping is a high-frequency trading strategy focused on profiting from small price changes by making a large number of trades throughout the day. Scalpers hold positions for extremely short periods, often just seconds or minutes, aiming to capitalize on micro-movements in the bid-ask spread. This strategy requires strict discipline, a high tolerance for risk, and fast execution to be successful.
11. Momentum Trading
Momentum trading is a strategy centered on the principle that a security’s price, once it begins to move in a particular direction, is likely to continue in that direction for a period. Momentum traders identify stocks or other assets that are trending up or down with high volume and ride the trend until it shows signs of reversal. This approach relies on identifying and capitalizing on the market’s psychological herd behavior.
12. Support & Resistance
Support and resistance levels are critical concepts in technical analysis. A support level is a price point at which a security’s price tends to stop falling and may reverse direction due to an increase in buying interest. A resistance level is a price point at which an uptrend is expected to pause or reverse due to a surge in selling pressure. These levels are often visualized as horizontal lines on a chart and are used by traders to identify potential entry and exit points.

13. Breakout
A breakout occurs when a security’s price moves decisively above a resistance level or below a support level, typically accompanied by a significant increase in trading volume. Traders interpret a breakout as a strong signal that the previous trend has ended and a new, more powerful trend is likely to begin in the direction of the breakout. Trading breakouts is a common strategy used to enter new positions at the start of a trend.
14. Risk-Reward Ratio
The risk-reward ratio is a measure used to compare the potential profit of a trade to its potential loss. It is calculated by dividing the distance from the entry point to the stop-loss level (risk) by the distance from the entry point to the target price (reward). For example, a trade with a risk-reward ratio of 1:3 indicates that the trader is risking one dollar for every three dollars they expect to gain. A favorable risk-reward ratio is a cornerstone of effective risk management.
15. Technical Analysis
Technical analysis is a methodology for evaluating securities and attempting to forecast future price movements by analyzing historical market data, such as price, volume, and volatility. Technical analysts believe that all relevant information about a security is already reflected in its price and that market trends and patterns tend to repeat themselves. They use a variety of charting tools and indicators, such as moving averages and oscillators, to identify patterns and predict future price action.
In day trading, a solid understanding of these fundamental terms is not merely a formality but a necessity. The ability to quickly recognize and apply concepts like bid/ask spreads, liquidity, and support/resistance levels is crucial for informed decision-making and effective risk management. Continuous education and a commitment to mastering this vocabulary are foundational steps for any trader seeking to navigate the market with precision.


