


Summary (TL;DR)
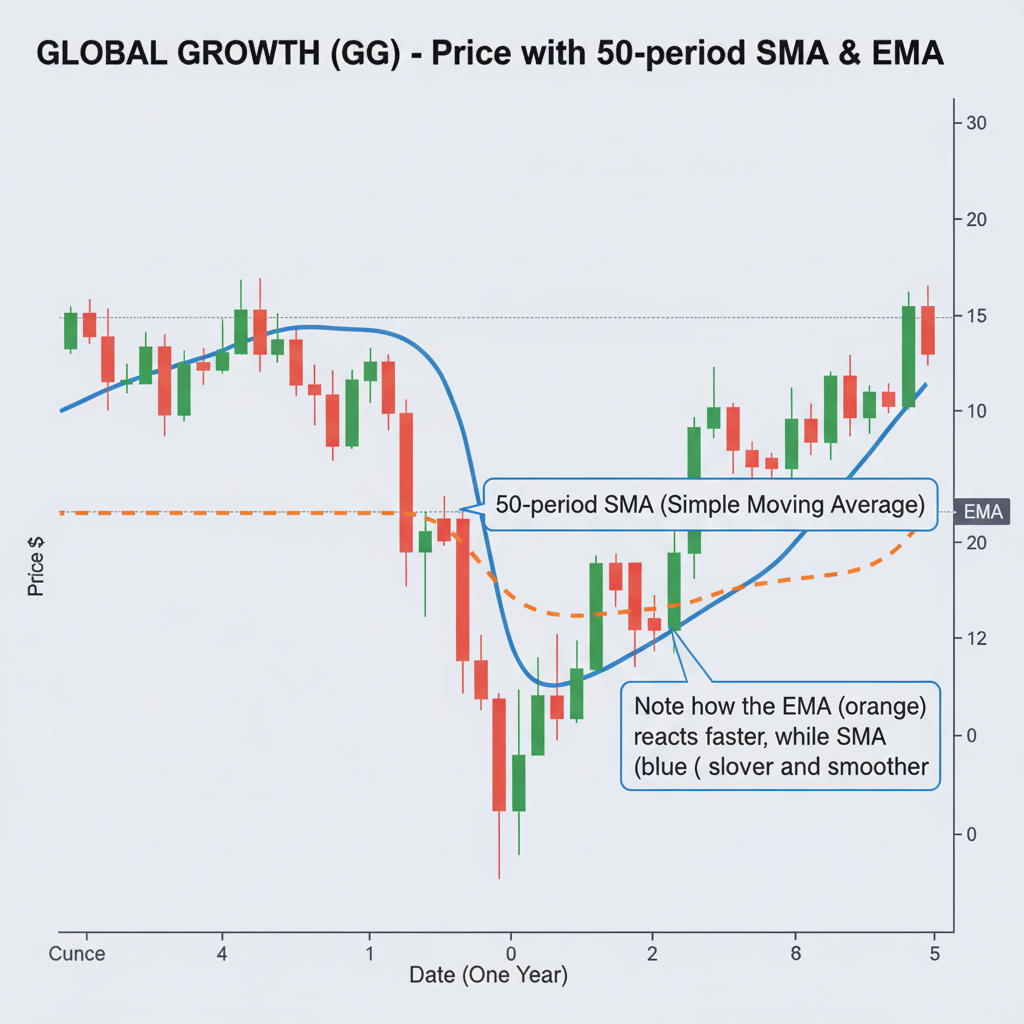
Moving averages are fundamental tools that smooth out price data to reveal the underlying trend, much like a filter clarifies a noisy signal. The Simple Moving Average (SMA) gives equal importance to all prices in its period, resulting in a smooth, stable line ideal for long-term trend analysis. The Exponential Moving Average (EMA) gives more weight to recent prices, making it faster and more responsive to new market shifts. The one you choose depends entirely on your strategy and timeframe.
Introduction: Reading the River’s Flow
In the chaotic theater of the market, prices leap and dive with every rumor, report, and reaction. To make sense of this, traders have long sought tools to look beyond this daily “noise” and see the bigger picture. Among the oldest, most trusted, and most versatile of these tools is the moving average. It is a simple line on a chart, but it is rich with information, helping us answer one of the most fundamental questions in investing: “Ignoring the momentary volatility, which way is the price generally headed?”
A Look Back in Time
Long before personal computers placed the market at our fingertips, analysts calculated moving averages by hand with pencil and ledger. The concept was a cornerstone of early trend-following theories in the 20th century. Analysts understood that a simple average, updated daily, could provide a clearer sense of an asset’s momentum than the raw, erratic price. The popularization of technical analysis in the mid-1900s brought the moving average to a wider audience, and the computer revolution of the 1980s made it an indispensable, instantly accessible tool for every retail trader and investor on the planet.
The Core Concept (Explained with Analogy)
Imagine two drivers navigating the same highway, both using their rearview mirrors to understand the traffic’s flow.
The Simple Moving Average (SMA) is a cautious, long-haul truck driver. This driver looks deep into the rearview mirror, considering their average speed over the last 20 miles. They aren’t rattled by a single sports car that zips past them; their goal is to understand the broad, steady flow of traffic. Their path is smooth and deliberate.
The Exponential Moving Average (EMA) is a responsive sports car driver. This driver is also checking their mirror, but their primary focus is on the cars immediately behind them. If traffic suddenly speeds up, they react almost instantly. This allows them to be more nimble, but it also means they might occasionally overreact to a short-lived burst of speed.
Both drivers are looking backward to inform their journey, but their focus and therefore their reaction time is fundamentally different.
A Real-World Connection
Perhaps the most famous (or infamous) real-world application of moving averages is the “Death Cross.” This occurs when a shorter-term moving average (typically the 50-day SMA) crosses below a longer-term moving average (the 200-day SMA). In late 2007, this exact signal appeared on the charts of major indices like the S&P 500. While the market was still near its highs, this ominous crossover signaled that short-term momentum was weakening much faster than the long-term trend could support. It acted as a stark, technical warning of the major trend change that would ultimately unfold as the 2008 financial crisis.
From Theory to Practice
To truly understand these tools, we must look under the hood.
- The Math Explained:
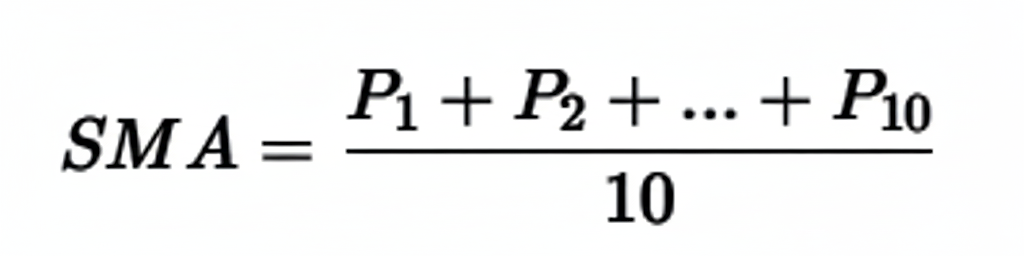
- SMA: The calculation is straightforward. For a 10-day SMA, you simply sum the closing prices of the last 10 days and divide by 10.
- EMA: The math is more complex, but the concept is simple. It applies a weighting multiplier that decreases exponentially for older data. The most recent price gets the most weight, the price before it gets slightly less, and so on. The key takeaway is that the EMA is designed to reflect new information more quickly than the SMA.
- Choosing Your Period: The “period” or “length” of an MA is the number of bars it looks back on. The period you choose should align with your goals:
- Short-Term (e.g., 5, 10, 20 periods): Favored by day traders and swing traders to capture short-term momentum.
- Mid-Term (e.g., 50 period): Often used to gauge the intermediate trend. A price above the 50-day MA is widely considered to be in a healthy uptrend.
- Long-Term (e.g., 100, 200 periods): Used by position traders and long-term investors to identify and confirm the primary, overarching trend. The 200-day MA is one of the most-watched indicators in all of finance.
- Primary Applications:
- Trend Identification: The simplest use. Is the price generally trading above the MA? The trend is likely up. Is it below? The trend is likely down. The slope of the MA itself is also a crucial clue.
- Dynamic Support & Resistance: In an uptrend, a rising moving average will often act as a moving “floor” (support) where buyers step in on pullbacks. In a downtrend, a falling MA can act as a “ceiling” (resistance).
- Crossover Signals: As seen in the Death Cross example, when a shorter-term MA crosses over a longer-term MA, it can signal a potential change in trend. The opposite, a “Golden Cross,” is considered a bullish signal.
A Brief Illustration
A stock has been in a strong, steady uptrend for months and is currently trading at $180. Its 50-day Simple Moving Average is rising and currently sits at $165. Over a few days, the stock’s price pulls back to $166. A trader using moving averages sees this not as a panic signal, but as a potential opportunity. The price is testing its area of dynamic support (the 50-day SMA). If the price bounces off this level and continues upward, it confirms the strength of the underlying trend.
The Chapter’s Wisdom (Key Takeaways)
- SMA is for Stability: Use the Simple Moving Average when you want a smooth, clear view of the long-term trend and want to avoid reacting to minor volatility.
- EMA is for Speed: Use the Exponential Moving Average when your strategy requires a quicker reaction to recent price changes and new momentum.
- Match the Tool to the Job: Your chosen period (e.g., 20-day vs. 200-day) must align with your trading or investment timeframe.
- They Are Reactive, Not Predictive: Moving averages show you what has happened, not what will happen. They are tools for trend confirmation, not fortune-telling.
Chapter Glossary
- Simple Moving Average (SMA): An average calculated over a specific number of periods where each data point is given equal weight.
- Exponential Moving Average (EMA): An average calculated over a specific number of periods where more recent data points are given greater weight.
- Lookback Period: The number of past data points (e.g., 20 days, 50 hours) used in the calculation for an indicator.
- Dynamic Support/Resistance: A price level that is not fixed (like a horizontal line) but is constantly changing, often represented by a moving average.
- Crossover: An event where two different moving average lines cross over one another on a chart, often used to signal a potential change in trend.
Food for Thought (Engagement Prompt)
- In a choppy, “sideways” market where the price isn’t trending in either direction, which moving average (SMA or EMA) do you think would generate more false buy/sell signals? Why?
- Some traders use a “moving average ribbon” (multiple MAs of different periods on one chart). What potential benefit could seeing the 10, 20, and 50-period MAs all at once provide?
Additional Topics to Explore
- Volume-Weighted Average Price (VWAP): Understanding the VWAP – The True Price of the Day.
- VWAP vs. Moving Averages: The Anchor and the River: A Tale of VWAP and Moving Averages.
- Bollinger Bands: A Beginner’s Guide to Bollinger Bands – The River of Price.
- RSI & Moving Averages: A System for Combining Moving Averages and RSI.