


Summary (TL;DR)
Bollinger Bands are three lines drawn on a financial chart that act as a dynamic channel around a security’s price. The middle line is a simple moving average, while the outer bands represent levels of relative highness and lowness based on volatility. They help traders visualize how volatile a market is and whether prices are overextended.
Introduction
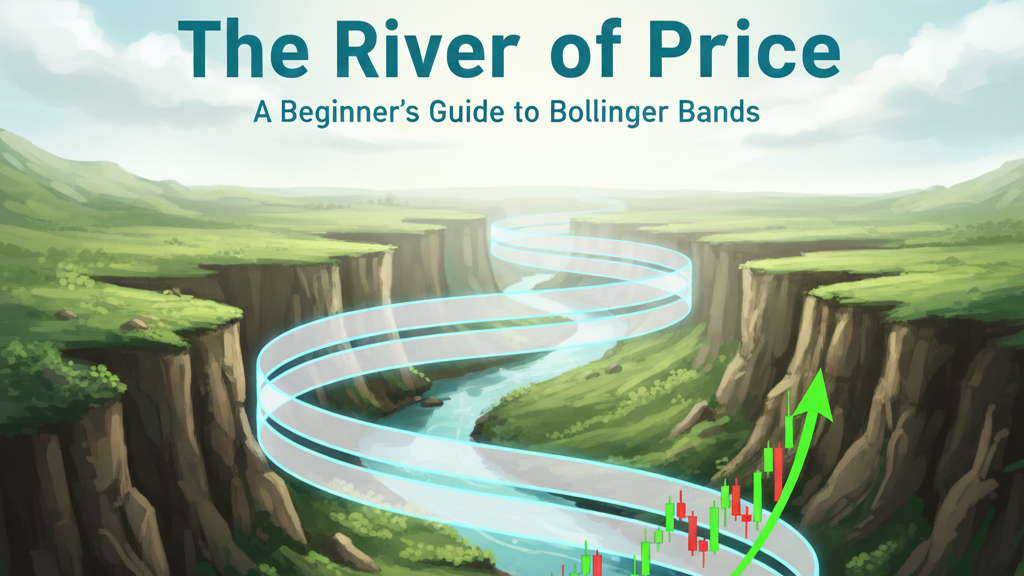
Imagine trying to navigate a vast, winding river in a small boat. Without being able to see the riverbanks, you would have no context. Are you in the middle of the channel, or are you about to run aground on a hidden sandbar? This is what looking at a price chart can feel like without the right tools. Price moves up and down, but those movements are meaningless without context. Bollinger Bands are the riverbanks. They provide a clear, visual framework that tells you not just where the price is, but where it is relative to its recent behavior, helping you navigate the ever-changing currents of the market.
A Look Back in Time
In the early 1980s, a financial analyst named John Bollinger faced a common problem. Existing tools that drew envelopes around price were too rigid; they were based on fixed percentages and failed to adapt to the market’s shifting moods. Markets can be sleepy and calm for weeks, then suddenly erupt with frantic energy. Mr. Bollinger sought a more intelligent, adaptive tool. He ingeniously incorporated the concept of standard deviation, a statistical measure of dispersion, to create bands that would automatically widen during volatile times and narrow during calm periods. He gave traders a tool that could breathe with the market, and in doing so, revolutionized technical analysis.
The Core Concept (Explained with Analogy)
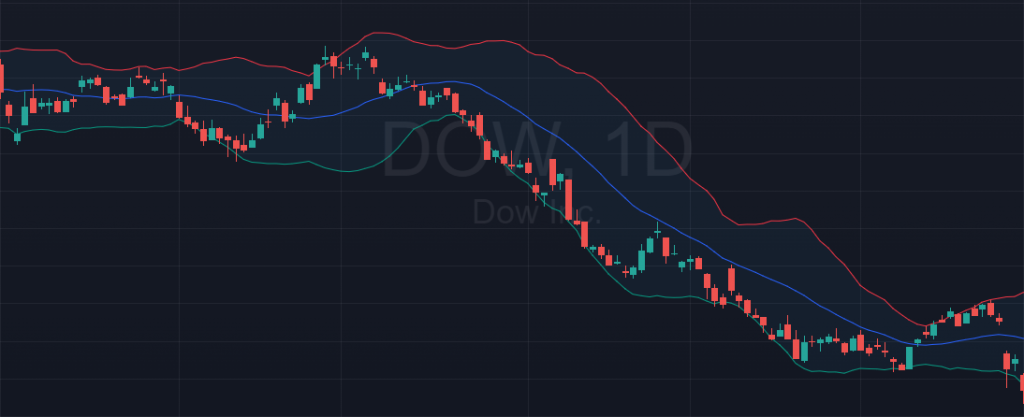
Let’s return to our “River of Price” analogy. The Bollinger Bands are made of three key parts that work together to map this river.
- The Middle Band (The River’s Current): This is the heart of the indicator, typically a 20-period Simple Moving Average (SMA). Think of it as the main current of the river. It tells you the average, smoothed-out direction of the price over the last 20 periods (be it 20 days, 20 hours, etc.). If the current is flowing uphill, the trend is generally up. If it’s flowing downhill, the trend is generally down.
- The Upper and Lower Bands (The Riverbanks): These are the true genius of the tool. They are the riverbanks, and they are not static. They are calculated by taking the middle band and adding (for the upper band) and subtracting (for the lower band) a certain amount, usually two standard deviations. Don’t let the term “standard deviation” intimidate you. All it means in this context is a measure of volatility.
- When the River Rages (High Volatility): After a major news event or during a powerful trend, prices start making big, wild swings. This is high volatility. Our river becomes a raging torrent. The standard deviation increases, which pushes the riverbanks the Bollinger Bands far apart. The channel becomes very wide.
- When the River is Calm (Low Volatility): When a stock is trading quietly with little news, the price action is subdued. This is low volatility. Our river becomes slow and lazy. The standard deviation decreases, and the riverbanks the Bollinger Bands move closer together, narrowing the channel. This tightening of the bands is a famous condition known as “The Squeeze.” Many traders believe a Squeeze signals that a period of high volatility, or a big price move, is just around the corner.
The price of a stock will spend most of its time, statistically about 90%, contained within these riverbanks. Therefore, a touch of a band is a notable event. A price hitting the upper band is like your boat bumping against the high bank; it’s a relatively high price compared to its recent past. A price touching the lower band is like hitting the low bank; it’s a relatively low price.
A Real-World Connection
Consider the global financial crisis in the fall of 2008. As Lehman Brothers collapsed and fear gripped the markets, volatility exploded. On a chart of the S&P 500 index during that period, the Bollinger Bands would have expanded to historic widths. They stretched dramatically further apart day after day, visually screaming that the market was in a state of extreme panic and uncertainty. The bands provided a clear visual cue that this was not normal price behavior; the river wasn’t just flowing, it was flooding over its historical banks.
From Theory to Practice
A trader doesn’t use Bollinger Bands to get simple “buy” or “sell” signals. Instead, the bands help answer crucial questions about the market’s state:
- How volatile is the market right now? A quick glance at the width of the bands provides an instant answer. Are they wide apart (high volatility) or tight together (low volatility)? This helps a trader decide what kind of strategy to employ.
- Is the current price high or low on a relative basis? If the price is touching the upper band, it signals that the security is “overbought,” or expensive relative to its recent average. If it’s touching the lower band, it suggests it is “oversold,” or cheap. This is not a signal to immediately sell or buy, but a powerful warning to pay closer attention.
- Is a big move about to happen? By identifying a Bollinger Band “Squeeze” (when the bands get very narrow), a trader can be on high alert for a potential breakout. The calm of the squeeze is often the precursor to a storm of activity.
A Brief Illustration
Imagine you are watching a stock, let’s call it TechCorp ($TC). For three weeks, its price has been moving sideways in a narrow range. On your chart, you notice the Bollinger Bands are the tightest they have been all year a classic Squeeze. You know this period of low volatility likely won’t last. The next day, the company announces better-than-expected earnings. The stock price surges upward, breaking decisively above the upper Bollinger Band on a huge spike in volume. For a trader, this breakout from the Squeeze could be interpreted as a strong signal that a new uptrend is beginning.
The Chapter’s Wisdom (Key Takeaways)
- Bollinger Bands are a tool for measuring volatility, not a standalone trading system.
- The bands widen when volatility is high and contract (Squeeze) when volatility is low.
- Prices touching the outer bands are not immediate buy/sell signals, but rather indications that prices are relatively high or low.
- A “Squeeze” often precedes a significant price breakout, either up or down.
- Always use Bollinger Bands in conjunction with other indicators and analysis to confirm signals.
Chapter Glossary
- Bollinger Bands: A technical analysis tool defined by a set of three lines: a simple moving average (middle band) and two outer bands based on standard deviation.
- Simple Moving Average (SMA): The average price of a security over a specific number of periods, used to identify the direction of the trend.
- Standard Deviation: A statistical measure of how spread out numbers are. In finance, it is used as a primary measure of volatility.
- Volatility: The degree of variation in an asset’s price over time; high volatility means large price swings.
- The Squeeze: A period of very low volatility where the Bollinger Bands contract to an abnormally narrow width.
Additional Topics to Explore
- Relative Volume (RVOL): The comparison of current volume to a stock’s average volume, used to spot unusual activity
- The September Effect: A contrasting anomaly where September has historically been the worst-performing month for stocks.
- Candlestick Patterns an Introduction: The Market’s Poetry.