


The Market’s Memory: Understanding Support and Resistance
Summary TLDR
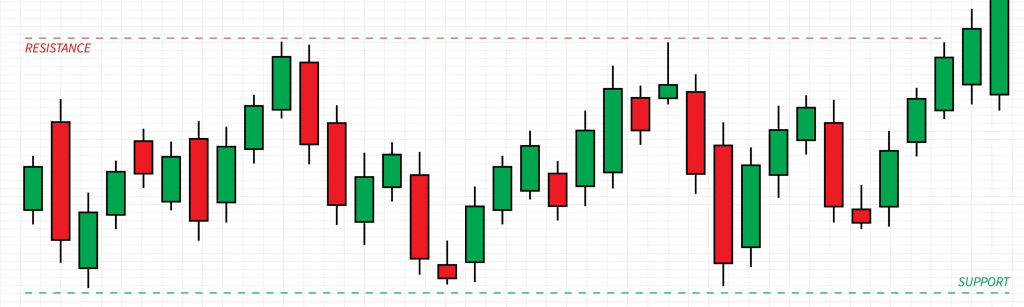
Support is a price level where buying pressure is strong enough to overcome selling pressure, causing a downtrend to pause or reverse. Resistance is a price level where selling pressure overcomes buying pressure, causing an uptrend to pause or reverse. These are key zones where the market has previously changed direction.
Introduction
A chart is more than just a record of price; it is a map of the market’s psychology, complete with a memory of past battles. Certain price levels become etched into this collective memory, acting as invisible barriers that influence future decisions. These barriers are known as support and resistance. They are the horizontal floors and ceilings that provide structure to the seemingly random movements of the market, representing key areas where the balance of power between buyers and sellers has historically shifted.
The Core Concept (Explained Simply)
Imagine a person bouncing a ball inside a multi-story building.
- The ball bounces up from the floor. This floor, which prevents the ball from falling further, is Support. In the market, support is a price level where a flood of buyers tends to enter, preventing the price from dropping lower. It is a floor built of buying interest.
- The ball hits the ceiling and comes back down. This ceiling, which prevents the ball from rising further, is Resistance. In the market, resistance is a price level where sellers tend to emerge in force, overwhelming the buyers and pushing the price back down. It is a ceiling built on selling interest.
Now, for the most crucial part: what happens when a barrier is broken?
If the ball is bounced hard enough, it breaks through the ceiling. That old ceiling, which was once a barrier to upward movement, now becomes the new floor for the story above it. This is the principle of role reversal. When a resistance level is decisively broken, it often becomes a new support level. Conversely, if the floor gives way and the ball falls through, that old floor becomes the new ceiling of the level below.
From Theory to Practice
Traders view support and resistance levels as the most important landmarks on a price chart. They are not exact lines but rather zones where market psychology is put to the test.
- How to Find Them: Traders identify these levels by looking at a chart’s history. They draw horizontal lines connecting previous significant turning points. A series of swing lows can define a support level, while a series of swing highs can define a resistance level. The more times a level has been tested and held, the more significant it becomes.
- Why They Give Patterns Significance: This is where context becomes critical. A candlestick pattern, such as a Hammer or a Bullish Engulfing pattern, is interesting on its own. But a bullish pattern that forms directly on top of a major, historically tested support level is a far more powerful and reliable signal. It shows that not only did buyers step in (the candlestick pattern), but they did so at a location where they have historically shown up in strength (the support level). This confluence of signals is what high-probability trading is built upon.
- How They Are Used:
- Entry Points: Traders often look to buy at support and sell at resistance.
- Breakout Trades: A strong move above a resistance level (a “breakout”) or below a support level (a “breakdown”), especially on high volume, can signal the start of a new trend.
- Risk Management: These levels provide logical places to set stop-loss orders. For example, when buying at support, a trader might place their stop-loss just below that level. If the level breaks, it’s a clear sign their trade idea was wrong.
A Brief Illustration
Let’s say a stock has repeatedly fallen to $98, only to find buyers and bounce back up. It has also risen to $105 several times, only to be sold off. Thus, $98 is a strong support zone, and $105 is a strong resistance zone.
A trader notices the stock is once again approaching $98. As it touches the level, a powerful Bullish Engulfing candle forms. This combination—a strong bullish pattern at a key support level—gives the trader the confidence to enter a long (buy) position. They place their protective stop-loss order at $97.50, just below the support zone. Their initial target would be the resistance level at $105.
Why It Matters
- They Provide Structure: Support and resistance levels frame the market, turning a chaotic chart into a structured map of potential turning points.
- They Highlight Key Decision Zones: These levels are where the battle between buyers and sellers is most intense. The outcome of these battles often determines the next major price move.
- They Amplify Signals: Technical patterns and signals gain immense credibility and significance when they occur at these historically important price levels.
Additional Topics to Explore
- Slippage: The specific problem that the stop-limit order is designed to solve.
- Candlestick Patterns an Introduction: The Market’s Poetry.
- Volume: The Market’s Pulse: Understanding Volume.